


Pivot Lines are lines of support and resistance which are calculated from the High(H), Low(L) and Close (C) price of the previous bar on the timeframe you are using. The most common used is Daily Pivot (Daily Pivot Lines). There are some trader who trade using 1 hour or 4 Hour pivot or 15 mins. Well, the choice is up to you and really depend on your experience and skill.
If you use daily pivot, you calculate the present day’s pivot using HLC price of the previous day. If you use 1 hour pivot, you should use HLC price of the previous hour.
The Pivot = P = (H+L+C) /3
1st Resistance Line = R1 = 2P- L
2nd Resistance Line = R2 = P+ (H-L) = P+(R1-S1)
3rd Resistance Line = R3 = 2P + (H-2L)
1st Support Line = S1 = 2P – H
2nd Support Line = S2 = P – (H-L) = P – (R1 – S1)
3rd Support Line = S3 = 2P – (2H – L)
How to trade using those lines? We use those lines as a reference lines of price motion. If price move above the Pivot (P), it usually will continue to move untill hitting R1. Price find it Resistance at R1, it can continue the upward move (breaking R1) or rebound to P. If price breaking the R1, it usually continue to move untill it meet the 2nd resistance line at R2. After price breaks R2, it usually move up to R3. And vice versa if the price move below the Pivot (P).
Above is the best case scenario. Sometime price stop just before reaching pivot lines and then reverse. In other occasion price go slightly past pivot line, allow a bit of leeway.
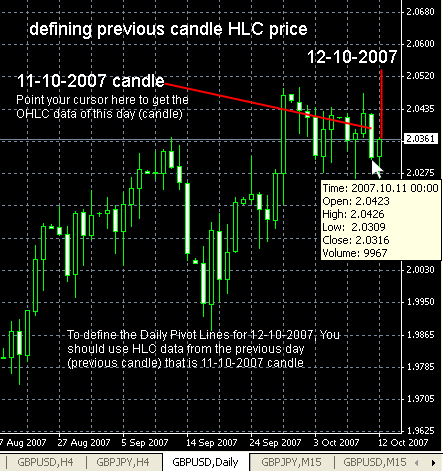
Defining previous day/candle OHLC (Open High Low Close) data
1. Open the chart on your chosen time frame. For this example purpose, we use daily timeframe
2. Point your cursor to previous candle close or open side and wait until a text box show up showing the candle OHLC data
3. That’s it.
See below picture for better figuring out
If you use daily pivot, you calculate the present day’s pivot using HLC price of the previous day. If you use 1 hour pivot, you should use HLC price of the previous hour.
The Pivot = P = (H+L+C) /3
1st Resistance Line = R1 = 2P- L
2nd Resistance Line = R2 = P+ (H-L) = P+(R1-S1)
3rd Resistance Line = R3 = 2P + (H-2L)
1st Support Line = S1 = 2P – H
2nd Support Line = S2 = P – (H-L) = P – (R1 – S1)
3rd Support Line = S3 = 2P – (2H – L)
How to trade using those lines? We use those lines as a reference lines of price motion. If price move above the Pivot (P), it usually will continue to move untill hitting R1. Price find it Resistance at R1, it can continue the upward move (breaking R1) or rebound to P. If price breaking the R1, it usually continue to move untill it meet the 2nd resistance line at R2. After price breaks R2, it usually move up to R3. And vice versa if the price move below the Pivot (P).
Above is the best case scenario. Sometime price stop just before reaching pivot lines and then reverse. In other occasion price go slightly past pivot line, allow a bit of leeway.
Defining previous day/candle OHLC (Open High Low Close) data
1. Open the chart on your chosen time frame. For this example purpose, we use daily timeframe
2. Point your cursor to previous candle close or open side and wait until a text box show up showing the candle OHLC data
3. That’s it.
See below picture for better figuring out